
- Lennart Baumgärtner

- May 19, 2025
- 3 min read
Updated: Aug 18, 2025
Utility companies and infrastructure investors face a central challenge in the UK’s energy transition: how to plan under deep uncertainty. Traditional climate-energy scenario modelling—such as the UK National Energy System Operator’s Future Energy Scenarios (FES)—offers sharply contrasting futures: from a no-change business-as-usual (BAU) to highly optimistic net-zero paths by 2050. Yet these endpoints lack probabilistic grounding, forcing stakeholders to guess at the likelihood of each and rendering capital allocation and regulatory decision-making precarious.
Quantifying Energy Transition Uncertainty with AI
Vallorii changes that. By using an AI model that draws on over 50 historical energy technology transitions and sifts through hundreds of scenario datasets, we generate a probability-weighted forecast that maps the full “solution space” for UK natural gas demand and gas infrastructure needs. This is not about predicting a single future—but about quantifying a range of plausible ones and assigning odds to each.
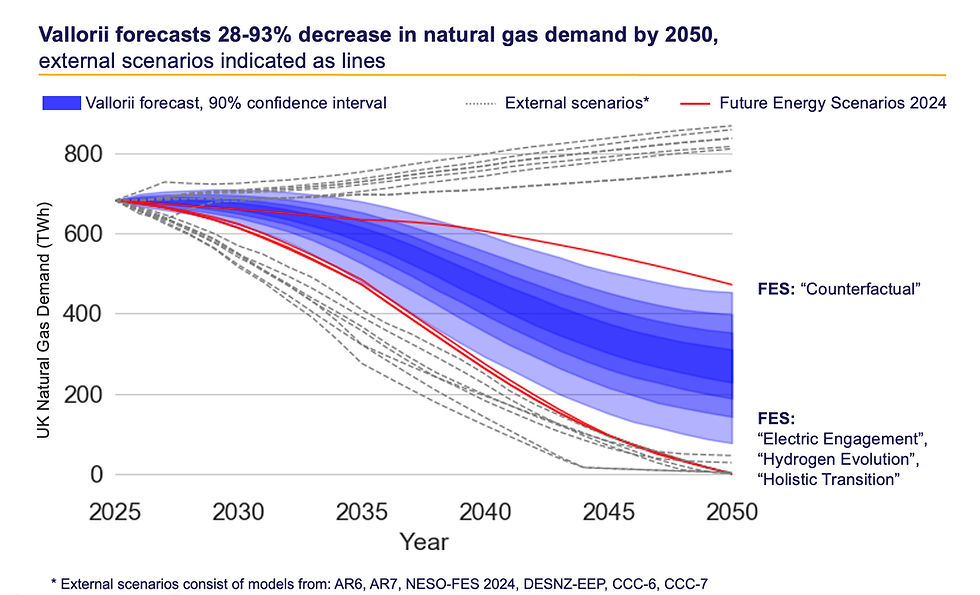
UK natural gas demand declines by between 28–93% by 2050 driven by policy, technology and consumers
Our AI-based analysis shows that natural gas demand in the UK could fall by anywhere from 28% to 93% by 2050, reflecting a broad range of possible interactions between policy ambition, consumer adoption, supply chain constraints, and technology maturity.
Figure 1: Moving from bi-modal scenarios to AI-based forecasts for the future of the UK gas demand
Demand for the gas network falls by “only” 7–56% as adoption of hydrogen and biomethane mitigates reductions in natural gas
While natural gas demand shrinks significantly, the outlook for the gas network infrastructure is more complex. Scenarios, like the FES, often polarize the future of the gas grid—suggesting either continued growth or full decommissioning depending on hydrogen (H₂), biomethane, and electrification uptake. But real-world transitions rarely follow binary trajectories.
Using Vallorii’s AI-driven approach, we find that the total reduction in gas network demand is likely between 7% and 56% by 2050, with up to 7% increase in demand by 2035 driven by economic growth and delayed electrification.
Figure 2: Gas network demand likely to rise until 2035, before falling until 2050

This result reflects key dynamics:
Hydrogen and biomethane substitution for natural gas occurs gradually, limited by policy incentives, infrastructure readiness, and social uptake.
Heat pump rollouts face consumer behavior hurdles and physical retrofitting constraints.
Interdependencies between technologies mean shifts are non-linear and often delayed.
These insights expose a significant medium-term growth potential for the gas grid until around 2035, raising doubts about arguments for immediate divestment or stranded-asset write-downs.
Scenarios are “what-if” stories but key business decisions require taking a view
Vallorii’s AI-based approach addresses two shortcomings of scenario modelling:
Bimodal outcomes – Net-zero scenarios often require aggressive and optimistic assumptions about renewables, carbon removals, and CCS, while BAU scenarios overlook policy momentum and social demand for decarbonization.
Lack of probabilistic framing – Scenarios are narratives, not predictions, and offer no guidance on how likely any one path is.
Traditional UK scenario analysis yields un-weighted storylines—“rapid transition” or “business as usual”. Lacking probabilities, CFOs and other decision-makers can only either overspend to cover the aggressive case or stall investment to hedge the conservative one, eroding option value.
Key business decisions instead require taking a view with numbers of likely futures. Vallorii replaces the traditional bimodal view with a probability-weighted fan chart that captures the full distribution of plausible outcomes and quantifies their likelihood.
As an example, scenarios merely warn “this asset could strand in future” but give no timeline, potentially forcing managers into premature write-offs or costly life-extension. A likelihood curve for load-factor decline supplies the missing clock: book impairments when the odds of sub-50% utilisation hit, say, 30%, shorten refinancing at say 60 %, and so on. For large gas assets, this optionality can save tens of millions in avoidable CAPEX.