


In regulated infrastructure, value is not a fixed concept. The value of an infrastructure asset depends on how it is measured and which accounting basis drives returns.
Different accounting frameworks produce markedly different views of the same asset base. Regulatory asset values (RAV), historical cost accounts, and current cost accounts (modern equivalent asset value, MEAV, or replacement cost), each serve distinct purposes. But when the differences between these measures changes, accounting starts to do more than describe reality. It start to influence it.
That dynamic is increasingly apparent in UK utilities.
The disconnect between balance sheets and physical reality
The tension is particularly visible in the gap between regulatory asset value and modern equivalent asset value.
RAV is the asset base on which companies are allowed to earn a return. The RAV was initially set at privatization, based on market valuations at the time. Subsequent regulatory price reviews have made compounding adjustments to the RAV through financial depreciation and slow-money expenditure. RAV declines through depreciation and increases through slow-money Totex.
MEAV, by contrast, reflects the estimated cost of replacing the existing network with a modern equivalent. It captures the scale of the infrastructure required to deliver current levels of service, irrespective of how those assets are treated within the regulatory framework. The MEAV can also change over time. Deterioration of services reduces the MEAV, as do technological innovation and performance improvements. Inflation increases the MEAV.
The two measures therefore operate on fundamentally different bases. RAV is shaped by cumulative regulated decisions; MEAV by physical and economic reality. The difference between both terms can be large. Utilities are often responsible for systems that are far larger, in physical terms, than those recognized for regulatory purposes. On a modern equivalent basis, asset values can exceed RAV by an order of magnitude.
Thames Water is an extreme case of this, as the company operates the largest and oldest water & wastewater network in the UK. With a RAV of ~£21bn, they operate an asset base of ~£200bn. Even more so, the financially distressed company is currently valued at around ~£10bn, highlighting that the financial reality has detached from the physical asset base.
| Measure | Value | What it is | Source |
|---|---|---|---|
| Regulatory accounting value (RAV) | ~£21bn | Ofwat reported RAV | March 2025 |
| Historical cost accounting (PP&E) | ~£21bn | Property, plant and equipment from balance sheet | March 2025 |
| Current cost accounting (MEAV) | ~£196bn | Gross Modern Equivalent Asset Value = ~£215bn (Discount applied to account for asset health deficit) | Thames Asset Health Deficit Report, 2023 |
| Valuation (NPV) | ~£11bn | Restructuring-implied enterprise value of ~£11bn (reflects consolidated borrowings of ~£17bn, less ~£6bn Class A write-off) | Class A restructuring update, 2026 |
How asset values shape bills and returns
This matters when we consider the bills customers pay, and services they receive in return. RAV sits at the center of the regulatory model. It determines allowed revenue, and, ultimately, customer bills. MEAV sits at the center of the performance utilities can provide.
Regulators apply a cost of capital to the RAV to set returns. As the asset base grows through investment, allowed revenues rise; as it is reduced through depreciation, they fall.
MEAV plays no direct role in this calculation. It reflects the cost of replacing the infrastructure required to provide current services, but it does not determine the base on which returns are earned.
The result is a structural disconnect. Companies must operate, maintain and, where necessary, replace assets based on their physical characteristics and replacement cost. But the financial framework through which they recover costs and earn returns is anchored to a different measure.
Incentives and the structure of the framework
This divergence has clear implications for incentives.
Thames Water illustrates this point. The 10x difference in RAV and MEAV reflects assets that have been depreciated out of the regulatory framework yet remain in active use.
Viewed against RAV, capital maintenance appears substantial, at around 20 percent. Measured against the full physical asset base, it is closer to 2 percent. Most of the infrastructure being maintained, in other words, sits outside the asset base on which returns are calculated.
Thames Water illustrative case study
Balance sheet view: physical asset base is 10x larger than its RAV
Asset value, £bn
Show the data as a table
| Category | Thames Water |
|---|---|
| Replacement cost (gross MEAV) | £215bn |
| Depreciated replacement cost (net MEAV) | £196bn |
| RAV | £21bn |
- ~£19bn adjustment for health deficit, between replacement cost (gross MEAV) and depreciated replacement cost (net MEAV).
- ~£175bn asset value that has been depreciated, but still requires maintenance and replacement.
| Component | Basis in the revenue requirement | Revenue Requirement | Fast Money | Slow money |
|---|---|---|---|---|
| Depreciation | Based on RAV | £0.7bn | £0.7bn | |
| RoRE | Based on RAV | £0.5bn | £0.5bn | |
| Interest | Based on RAV | £0.4bn | £0.4bn | |
| Enhancement | Based on MEAV | £0.2bn | £0.2bn | |
| Operation & Maintenance | Based on MEAV | £3.9bn | £2.3bn | |
| Capital Maintenance | £1.5bn | |||
| Total | £5.6bn | £3.9bn | £1.7bn |
This feature is not unique to water. In electricity transmission, regulators typically assume economic asset lives of around 45 years, while technical lives can extend well beyond that. Assets therefore remain in service after they have been largely depreciated for regulatory purposes.
The consequence is an asymmetry in how expenditure is treated. New capital investment, once added to the RAV, contributes directly to future returns. By contrast, maintaining assets that have already been depreciated does not increase the asset base in the same way.
Over time, this creates a structural bias. Investment that expands or renews the asset base is more directly linked to returns than expenditure on maintaining existing infrastructure. The framework does not dictate decisions, but it shapes the incentives around them.
There are signs this is playing out in practice. Real RAV across UK infrastructure has grown steadily in recent years, broadly outpacing underlying economic growth. Partly this reflects policy priorities, including investment linked to net zero. But it is also consistent with a system in which additions to the asset base are more directly rewarded than the upkeep of existing assets.
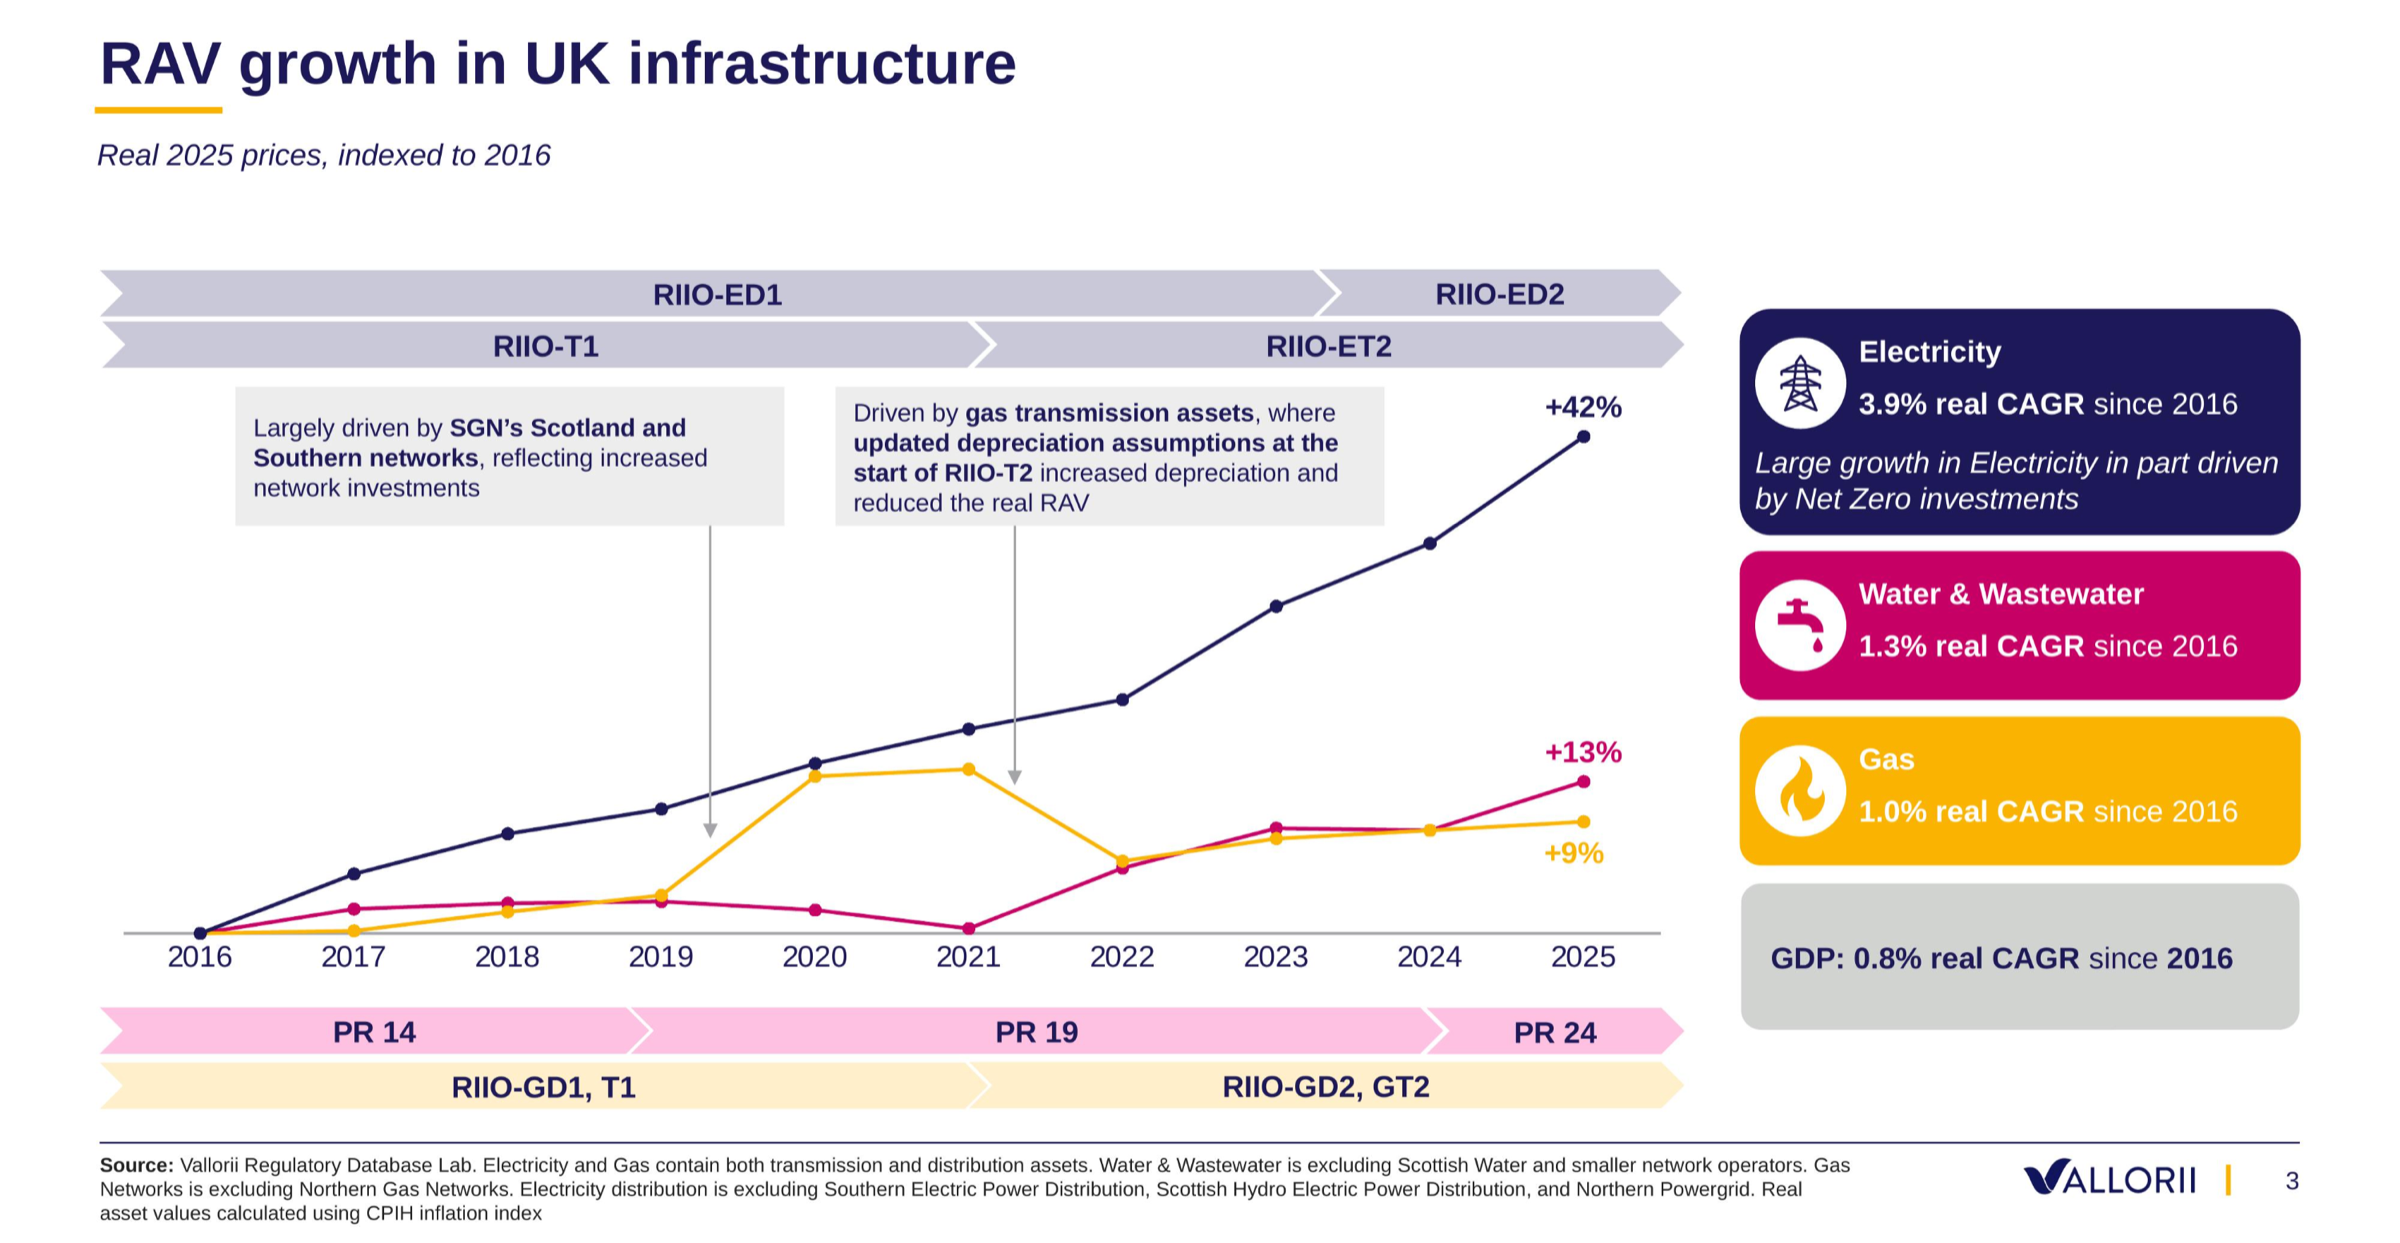
The gap between accounting value and physical reality is not new. But as infrastructure ages and capital needs increase, its effects are becoming harder to ignore.
The question is no longer whether the framework creates distortions, but whether it can continue to balance investment, affordability and long-term asset stewardship in their presence.
Sources
- Thames Water asset values (RAV about £21bn, MEAV, enterprise value): as printed on the figures, Ofwat reported RAV (March 2025), company balance sheet (March 2025), Thames Asset Health Deficit Report (2023) and Class A restructuring update (2026); Thames Water asset valuation estimates based on company disclosures and regulatory data.
- UK RAV growth by sector: Vallorii Regulatory Database Lab, as printed on the chart.