


Infrastructure debates tend to focus on what should be built next. Yet a more fundamental question sits beneath them: how quickly should we pay for what has already been built?
That question goes to the heart of depreciation. As discussions at the March roundtable underscored, it is emerging as a central lever in infrastructure economics and regulation. How does intergenerational fairness impact affordability?
Depreciation directly shapes returns, bill trajectories, and risk allocation over time. Choices on depreciation determine how costs are distributed between today’s consumers and future ones, making it a central lever in balancing affordability, investment incentives, and long-term system planning.
A system already carrying a high asset base
The UK approaches this question from an elevated starting point. It has a large existing asset base, much of which is already embedded in consumer bills.
Across energy, water and transport, the Regulated Asset Value (RAV) per capita is amongst the highest in Europe. In electricity and gas networks alone, asset values exceed £1,000 and £500 per person respectively, around 60 to 100 percent higher than in Italy and Spain. Total electricity, gas, water, and rail RAV amounts to roughly £3,000 to £3,400 per person in the UK and Belgium, 60 to 110 percent above some European peers.
Both consumer bills and investor returns are directly linked to the RAV. Higher RAV means that returns on regulated assets add around £60 to the average electricity bill in the UK, compared with roughly £30 in Italy or Spain. In gas, the comparable figures are £28 versus £10 to £20.
International comparison of asset values across infrastructure sectors
UK electricity network RAV is £1,082 per capita, against £669 in Italy and £1,482 in Belgium
Transmission and distribution asset values, £ per capita
- Total RAV per capita
- Total PPE per capita
Country
Show the data as a table
| Country | Total RAV per capita | Total PPE per capita |
|---|---|---|
| UK | £1,082 | £1,305 |
| Italy | £669 | £630 |
| Spain | n/a | £663 |
| Germany | n/a | £1,119 |
| Belgium | £1,482 | £1,356 |
UK gas network RAV is £513 per capita, against £708 in Italy and £665 in Belgium
Transmission and distribution asset values, £ per capita
- Total RAV per capita
- Total PPE per capita
Country
Show the data as a table
| Country | Total RAV per capita | Total PPE per capita |
|---|---|---|
| UK | £513 | £469 |
| Italy | £708 | £618 |
| Spain | n/a | £233 |
| Germany | n/a | £447 |
| Belgium | £665 | £576 |
Rail PPE is £1,320 per capita in the UK and £1,447 in Belgium; rail RAV is not given
Asset values, £ per capita
- Total RAV per capita
- Total PPE per capita
Country
Show the data as a table
| Country | Total RAV per capita | Total PPE per capita |
|---|---|---|
| UK | n/a | £1,320 |
| Italy | n/a | £518 |
| Spain | n/a | £854 |
| Germany | n/a | £560 |
| Belgium | n/a | £1,447 |
UK water and wastewater RAV is £1,694 per capita and PPE £1,665
Asset values, £ per capita
- Total RAV per capita
- Total PPE per capita
Country
Show the data as a table
| Country | Total RAV per capita | Total PPE per capita |
|---|---|---|
| UK | £1,694 | £1,665 |
| Italy | n/a | n/a |
| Spain | n/a | n/a |
| Germany | n/a | n/a |
| Belgium | n/a | n/a |
Asset values are expressed on a per-capita basis. Electricity and gas reflect the sum of onshore transmission and distribution assets; water reflects total water and wastewater assets; and rail reflects total rail PPE. All values are divided by the relevant population. For Spain and Germany, gas values are adjusted to reflect the estimated share of the population connected to the gas network, rather than total population.
Depreciation as a policy lever
Depreciation determines how quickly the RAV is paid back to investors. It has a direct impact on bills today and in the future. Accelerated depreciation increases bills today but lowers future RAV and bill impacts. Decelerated depreciation does the opposite: lower bills now, but a larger residual burden over time.
Regulatory approaches on depreciation are beginning to diverge. In gas, Ofgem has accelerated depreciation for new assets in line with their Net-Zero related discontinuation. In electricity, by contrast, the priority is enabling large-scale network expansion to support electrification, while managing the impact on bills.
There is, however, little consensus across sectors. When roundtable participants were asked whether depreciation should be accelerated to bring UK asset values closer to international benchmarks, views split sharply. Some favored faster depreciation to reduce long-term costs and align with peers. Others argued for maintaining current profiles as a balance between affordability and investment incentives. A third group supported slower depreciation to ease immediate bill pressures, even at the cost of higher future liabilities. However, the dominant view was that depreciation policy cannot be applied uniformly, and must reflect sector-specific dynamics.
This divergence reflects a deeper reality. Depreciation is not merely an accounting convention. It is a distributional choice, one that determines how costs are allocated over time.
10 of 24 poll responses said depreciation policy depends on the sector
Number of responses
Should electricity/gas depreciation be accelerated to reduce UK RAV per capita, into line with international comparators?
Show the data as a table
| Should electricity/gas depreciation be accelerated to reduce UK RAV per capita, into line with international comparators? | Responses |
|---|---|
| Yes: Accelerated depreciation (reduce future bills) | 5 |
| No: Maintain current depreciation profiles | 6 |
| No: Slow depreciation (reduce current bills) | 3 |
| Other / Depends on the sector | 10 |
The regional dimension: where depreciation meets inequality
These trade-offs become more acute when viewed geographically. The analysis draws on modeled infrastructure asset data from Vallorii Asset Intelligence, providing a granular view of regional variations across the UK.
Infrastructure asset values vary significantly across the UK. In London and Birmingham, they stand at around £2,700 per person. In Wales, they rise to approximately £4,300: some 60 percent higher. At the same time, incomes tend to move in the opposite direction, with lower average earnings in higher-cost regions.
The result is a pronounced divergence in affordability. Measured relative to income, the infrastructure burden is roughly three times higher in Wales than in London.
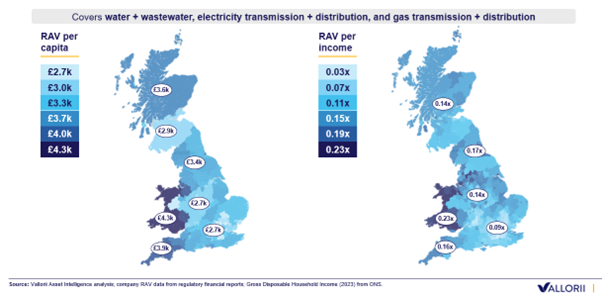
Depreciation interacts directly with this imbalance. Faster depreciation raises near-term bills, disproportionately affecting regions already under pressure. Slower depreciation defers costs, but locks in higher asset values that future consumers, often in the same regions, will have to fund.
This raises a related question: should regional disparities be actively mitigated? Here too, views diverge. Most participants supported cross-subsidization between regions; others pointed to cost reductions or service adjustments as more appropriate tools.
What is striking is that depreciation itself is not seen as the mechanism for addressing regional inequality. The debate instead separates into two distinct questions: who pays, and when. Redistribution addresses the former; depreciation governs the latter.
18 of 24 poll responses favored cross-subsidization to mitigate regional affordability risks
Number of responses
Should regional affordability risks (high local costs, low local income) be mitigated?
Show the data as a table
| Should regional affordability risks (high local costs, low local income) be mitigated? | Responses |
|---|---|
| Yes: Cross-subsidization (bills or taxes) | 18 |
| Yes: Reduction in costs and service quality | 1 |
| Yes: Reduced depreciation of RAV | 0 |
| No: Regional affordability is not a material risk | 5 |
An intergenerational choice
At its core, the depreciation issue is one of timing.
Depreciation determines how costs are shared between current and future consumers. Accelerating it brings costs forward; slowing it pushes them back. Neither reduces the total cost. Both reshape its distribution.
As infrastructure investment accelerates, driven by decarbonization, environmental standards and resilience, the size of the asset base will continue to grow. The pace at which those costs are recovered will become increasingly consequential.
Depreciation, in other words, can no longer be treated as a technical detail. It sits at the intersection of affordability, investor risk and long-term system planning, shaping not just how much consumers pay, but when they pay it.
Sources
- RAV and PPE per capita by country and sector: RAV and PPE data from company annual reports and financial statements and applicable regulatory disclosures, as printed on the chart.
- Regional asset values (around £2,700 per person in London and Birmingham, about £4,300 in Wales) and RAV relative to income: Vallorii Asset Intelligence analysis; company RAV data from regulatory financial reports; Gross Disposable Household Income (2023) from ONS, as printed on the map.
- Poll results: polls of participants at the Vallorii March 2026 Roundtable (24 responses to each question).