


Infrastructure investment is increasingly shaped by pressures that sit outside asset design and regulatory intent. Household budgets are under strain, utility bills are rising faster than incomes, and sensitivity to affordability is increasing. Together, these forces are changing the context in which long-lived infrastructure assets are planned, financed, and delivered.
The issue is not whether infrastructure investment is needed. It is whether future consumers will be willing and able to pay for the scale of capital programs now being proposed.
This is the question this analysis addresses.
Affordability today: already stretched
UK households already spend a high share of income on utilities by international standards.
Today, median UK households spend just over 7% of disposable income on utility bills, compared to around 3-5% in European comparators. For lower-income households, the picture is tighter still: savings rates fall sharply, leaving limited headroom to absorb further bill increases.
This matters because affordability is not evenly distributed. As bills rise, pressure concentrates on those least able to smooth shocks, increasing the political salience of utility pricing decisions.
UK annual household disposable income in 2024 is 36,663 GBP
Annual household disposable income 2024, GBP (higher is better)
Country
Show the data as a table
| Country | Median wage |
|---|---|
| UK | 36,663 GBP |
| France | 33,437 GBP |
| Germany | 36,135 GBP |
| Spain | 25,260 GBP |
| Sweden | 35,214 GBP |
| Belgium | 39,834 GBP |
| Italy | 26,958 GBP |
UK utility bills are 7.3% of disposable income, against 3.3% to 5.2% in the other six countries
Annual cost of utility bills, % of disposable income (higher is worse)
Country
Show the data as a table
| Country | Utility bills |
|---|---|
| UK | 7.3% |
| France | 3.3% |
| Germany | 4.3% |
| Spain | 3.9% |
| Sweden | 3.9% |
| Belgium | 4.8% |
| Italy | 5.2% |
The UK average income tax rate is 15.5%, the lowest of the seven countries
Average income tax rates, % of income (higher is worse)
Country
Show the data as a table
| Country | Tax rate |
|---|---|
| UK | 15.5% |
| France | 16.7% |
| Germany | 16.7% |
| Spain | 16.0% |
| Sweden | 16.1% |
| Belgium | 25.7% |
| Italy | 20.9% |
The UK savings rate is 11.7% of disposable income, the lowest of the seven countries
Average national savings rate, % of disposable income (higher is better)
Country
Show the data as a table
| Country | Savings rate |
|---|---|
| UK | 11.7% |
| France | 17.9% |
| Germany | 20.0% |
| Spain | 12.7% |
| Sweden | 18.2% |
| Belgium | 12.9% |
| Italy | 12.0% |
The trajectory: bills rise faster than incomes
The forward-looking picture is more challenging.
Using OBR and ONS wage forecasts alongside sector specific capital expenditure projections, the analysis shows that utility bills are expected to rise by around 21-25% by 2040. This increase is driven primarily by large capital programs in electricity generation, electricity networks, and water and wastewater.
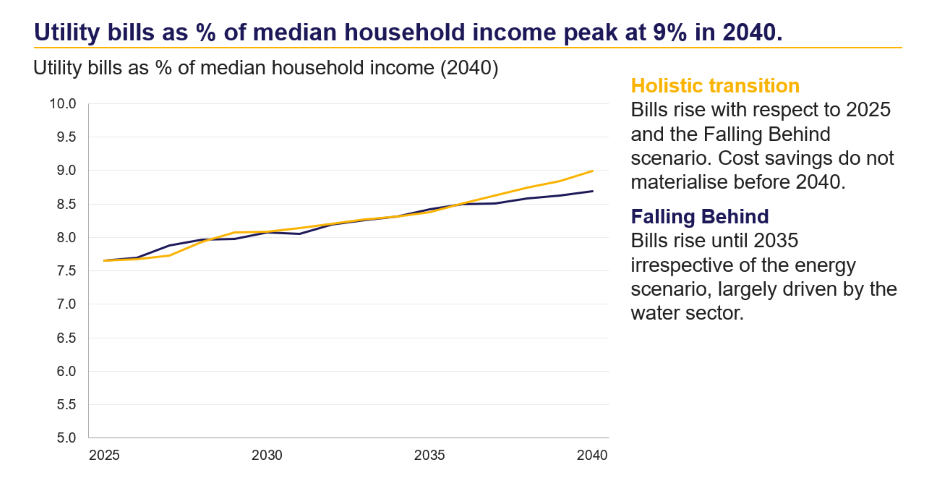
Over the same period, real household incomes grow more slowly. As a result, utility bills are projected to peak at around 8.6-9.0% of median household income by 2040, up from just over 7% today. On current projections, 45-49% of the UK population could be spending more than 10% of income on utilities by that point.
This trajectory is largely structural. Even under alternative energy scenarios, bills continue to rise through the 2030s, with limited scope for early cost savings to offset capital-driven increases. Water and wastewater alone see significant bill growth during AMP8, with further capital expansion expected in subsequent periods.
Expectations are aligned with the trajectory
This analysis is consistent with industry expectations. In polling during the January Roundtable, a clear majority of participants expected consumer bills across sectors to increase over the next decade, with affordability worsening rather than improving or stabilizing. Few anticipated that economic growth or efficiency gains would be sufficient to offset rising bills.
16 of 25 poll responses expected bills to increase as affordability worsens
Number of responses
How will household energy bills change over the next few years?
Show the data as a table
| How will household energy bills change over the next few years? | Responses |
|---|---|
| Decreasing bills: investments pay for themselves | 0 |
| Decreasing bills: investments won't happen | 1 |
| Bills remain at today's levels | 6 |
| Increasing bills: economic growth outpaces bills | 2 |
| Increasing bills: affordability will worsen | 16 |
Affordability and political sensitivity
Affordability does not operate in isolation. It interacts directly with politics.
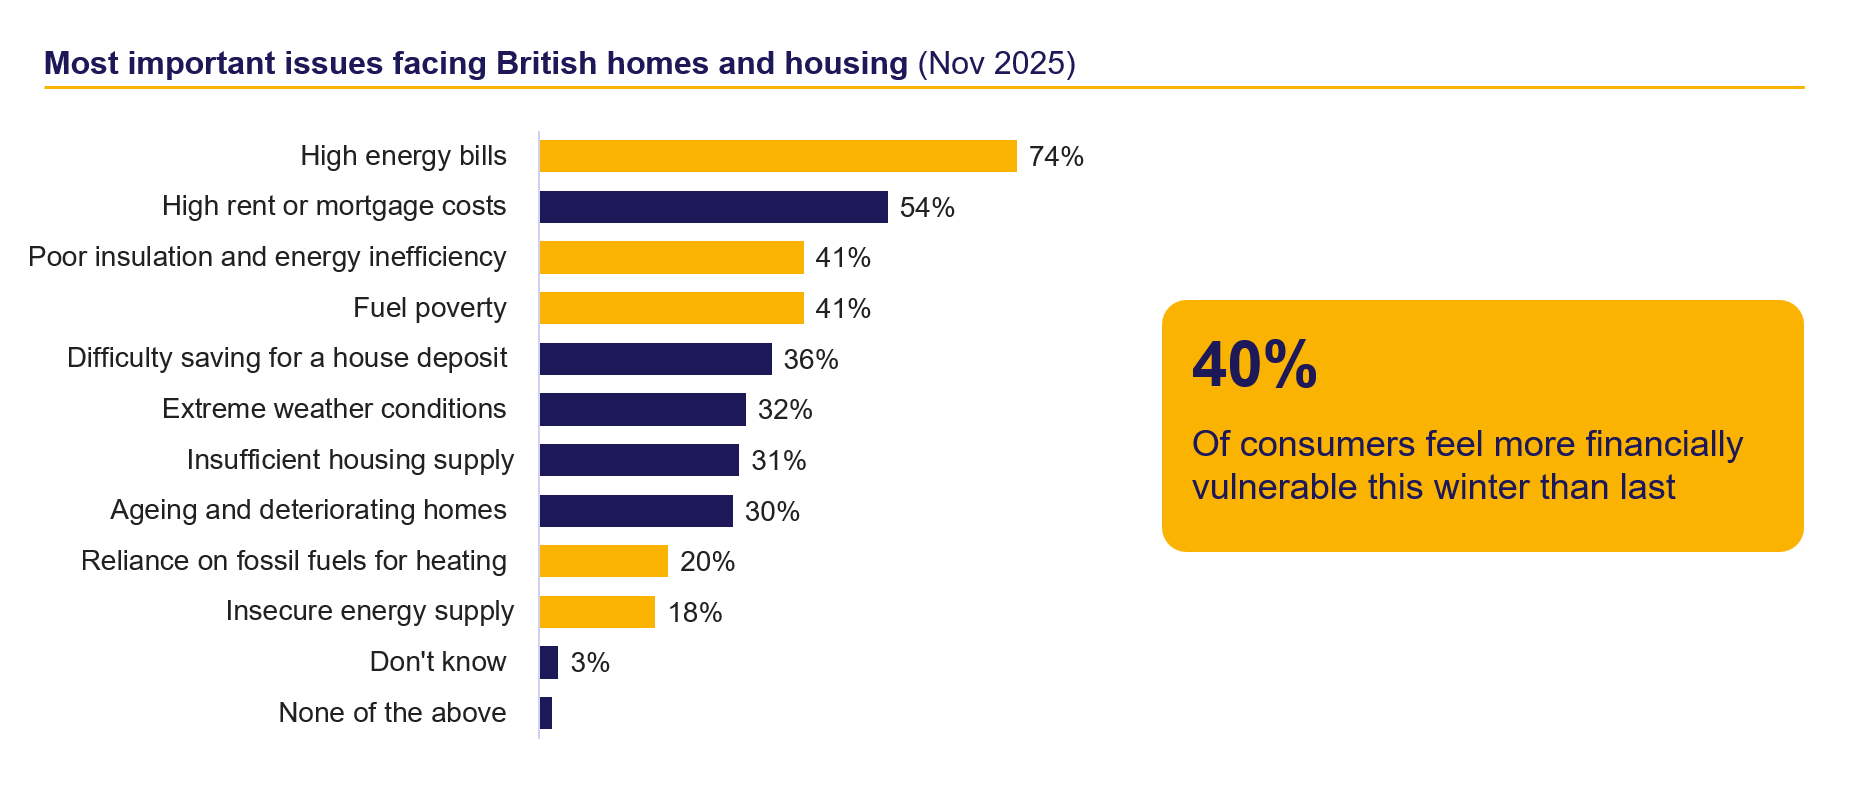
High utility bills consistently rank among the most important concerns for UK voters. Survey evidence shows that concerns about energy bills, housing costs, and fuel poverty dominate perceptions of financial vulnerability. As affordability deteriorates, tolerance for further increases declines, raising pressure on policymakers and regulators to intervene.
This matters because infrastructure assets are long-lived and capital-intensive. Investment decisions made today rely on assumptions about future willingness to pay over decades. When affordability weakens, those assumptions become less stable, increasing uncertainty around the delivery, timing, and structure of investment programs.
In that sense affordability is not simply a distributional issue. It is a system-level constraint that shapes the political and regulatory environment in which infrastructure operates.
Setting the context for infrastructure investment
Affordability defines the conditions under which infrastructure investment takes place. It shapes public tolerance for bill increases, constrains regulatory choices, and influences the stability of long-term planning assumptions.
As capital programs expand across energy and water, these pressures become more pronounced. The analysis shows that future investment decisions will increasingly be made in an environment where affordability pressure is not easing, but intensifying.
The conclusion is straightforward. Affordability is no longer a background consideration for infrastructure planning. It is becoming a binding constraint that will increasingly shape what can be built, when it can be delivered, and under what conditions.
Sources
- Bill forecasts (bills rising by around 21-25% by 2040, peaking at around 8.6-9.0% of median household income, 45-49% of the population spending more than 10% of income on utilities): Vallorii analysis using OBR and ONS wage forecasts and sector-specific capital expenditure projections.
- Poll results: poll of participants at the Vallorii January 2026 Roundtable (25 responses).